
 @andy_1robertson
Blog
There are multiple websites, blogs and pages on the internet with information about bovine TB. Given the highly polarised and political arguments surrounding the subject I would recommend that anyone approaches information they read online with a certain amount of caution, particularly if it is unclear who the author is, or where they are getting their information. Personally I would recommend www.Tbhub.co.uk which is supported by AHDB, BCVA, DEFRA, Landex and the NFU, as a key website with reliable information on bovine TB. Throughout my work I will aim to get the content I produce (articles, fact sheets etc) uploaded to the TBhub where possible. This page acts as a ‘Blog’ for me to talk about some of this work as it progresses and also highlight other information on the subject of bovine TB.
TB trends in badger cull areas – latest data published
January 28th 2021
Back in October 2020, Defra/APHA published the latest results for the trends in cattle TB inside of the badger cull areas. These trends alone cannot prove the impact of culling, but they contribute to ongoing discussions and debate.
While the TB dashboard I have developed has now been taken over by Defra (accessible here), they do not have a page to show these results for the badger control areas. So I have taken this latest report and uploaded the data in an interactive version accessible via the links below….
https://btb-statistics.shinyapps.io/badger_cull_area_tb_trends_2013-2019/

This Knowledge exchange project has officially ended but I will try and post useful links and info like the data above. Any comments or queries feel free to contact me.
Interactive Biosecurity infographic now online
November 16th 2020
The bacteria which causes bovine TB (Mycobacterium bovis) is a very adaptable, surviving in many different hosts and farm environments, which can act as sources of transmission to cattle.
Measures to reduce these risks and protect cattle herds are often termed ‘biosecurity’ In reality every herd and farm is different, which means the potential risks and their solutions can vary from farm to farm. Visualising transmission risks can be difficult and finding the necessary information on what to do about them on TBhub and other websites can also seem tricky. As part of my work I have created an interactive infographic to display many of the key transmission risks in and around farm yards. If you click on each risk factor it offers links to info on this website and the TBhub.
Note: Absolutely every possible risk factor is not mentioned here. There are others such as badger urine on pasture, or dead wildlife carcases (deer or badgers) that may also act as risks. There are also further risks from cattle, particularly the risk of residual infection within herds. The aim of the infographic is to highlight the main risk factors highlighted by Defra’s five point plan which can often (but not always) be addressed by simple practical measures, and then provide links to useful resources available online.
To view this infographic full screen click here

Badger Vaccination guide documents published
November 16th 2020
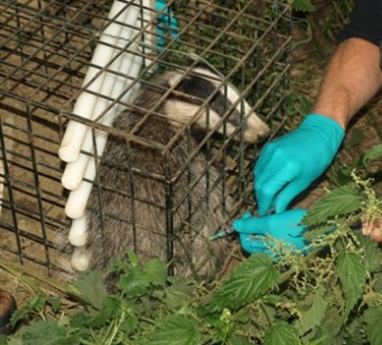
Setting up a new badger vaccination project can be a challenge, particularly for those who have not vaccinated badgers before.
There are a number of steps you need to take to plan a project, and important information which is needed while you are conducting the vaccination itself. In the past three years I have attended many meetings with those vaccinating badgers and those hoping to set up their own projects in the future. It was clear from those meetings that although there was some information on government websites, there was not enough guidance and advice readily available online.
To try and rectify this I have created two new guide documents which are available on this website below (also see the factsheets page) and on the TBhub here. Producing these documents was a long process and I certainly cannot take all of the credit, I had plenty of input from APHA, DEFRA, Natural England, the National Trust, Derbyshire Wildlife Trust and the Cheshire badger vaccination project. The aim was to gather as much advice and guidance from these organisations as possible and to share this with others.
There are two guide documents:
Planning a badger Vaccination project.
This covers the steps you need to consider when planning a new project. This includes the badger survey, sourcing equipment, veterinary guidance, applying for the licence and other important steps.

The badger Vaccination Process.
This is a guide for those conducting vaccination and has tips and reminders on how to catch badgers and administer the vaccine. This acts as a supplement to the approved training courses, but is not a replacement. If you intend on vaccinating badgers you still need to attend one of these courses.

If you have ideas on additional things to include in these guide documents then suggestions are always welcome!
TB transmission from badgers to cattle – new study published
December 20th 2019
Badgers are a wildlife host for M. bovis and they are implicated in the transmission of the bacteria to cattle, but proving that badgers can actually infect cattle is actually quite difficult.

Evidence of transmission between species include the following studies:

Location of major spoligotypes in cattle in 2014
- Experimental captive trials – a study by Little et al. (1982) demonstrated that cattle housed with infected badgers became infected with M. bovis (in an artificial setting).
- Spoligotyping data – Genetic strains (or spoligotypes) of M. bovis often have localised distributions, suggesting a local source of infection. Strains of M. bovis in cattle also typically match local strains in the badger population, suggesting some degree of transmission between species (Goodchild et al. 2012).
- Outcomes of culling trials – Changes (both positive and negative) in TB incidence in cattle following the RBCT suggest that badgers can transmit M. bovis to cattle (summarised here).
During the RBCT there was also an increase in TB in badgers linked to the pause in TB testing during the foot and mouth outbreak (Woodroffe et al. 2006), suggesting cattle can transmit infection to badgers. The occurrence of disease outbreaks in badgers in the low risk area well away from the main epidemic (such as in Cumbria) also suggests that the movement of infected cattle can spread the disease to wildlife.
Despite the above evidence, there is still much uncertainty over the rates of disease spread from badgers to cattle, and from cattle to badgers. Can badgers really transmit M. bovis to cattle? Can cattle infect badgers? This fuels some of the debate over the role of wildlife in bovine TB.
A new study by published in elife sheds light on rates of transmission from badgers to cattle and cattle to badgers:
Crispell J, Benton CH, Balaz D, De Maio N, Ahkmetova A, Allen A, et al. Combining genomics and epidemiology to analyse bi-directional transmission of Mycobacterium bovis in a multi-host system. eLife.
What did the study involve?

The study used samples from the long term study population of badgers at Woodchester Park in Gloucestershire.
The study involved the detailed genetic analysis of M. bovis isolates from badgers in Woodchester Park in Gloucestershire, the badgers in this study area are regularly trapped and sampled to test for M. bovis infection (for a description of the woodchester study see this review I co-authored). Isolates of M. bovis were also analysed from slaughtered cattle testing positive for bTB within 10 km of the woodchester study area.
Using WGS (whole genome sequencing – where the DNA of the M. bovis is analysed in detail) the authors constructed a phylogenetic tree to measure how closely the different M. bovis isolates were related. A phylogenetic tree is similar to a family tree, it shows how different isolates of M. bovis group together (into ‘clades’) and can be used to infer the direction of transmission from samples higher up the family tree to those on the lower branches. For example if M. bovis from a badger sample is located above cattle samples in the phylogenetic tree (i.e. the badger sample is the ancestor of the cattle samples) this indicates transmission from badgers to cattle
The authors also used a range of statistical modelling tools to estimate the rates of transmission both within species (cattle to cattle, badger to badger) and between species (cattle to badger, badger to cattle) that best explains the genetic patterns observed in their data.
What were the results?
The phylogenetic tree constructed from the genetic sampling provides good evidence of disease transmission between the species. If there was no transmission from badgers to cattle (or visa versa) there would be distinct genotypes of M. bovis in badgers and cattle, with the different species clustering together in separate groups, on different branches of the phylogenetic (family) tree. This study found that this was not the case, the genotypes of M. bovis were very closely related to the M. bovis in badgers, and several groups on the phylogenetic tree contained a mix of badgers and cattle. This provides good evidence of transmission between the species.

Figure 1 from the paper. Click on this image to enlarge.
The figure above shows the phylogenetic tree from the paper, this is like a family tree but it is so wide it is curled into a circular shape so it can fit in one image. The different colours are clades, or groups with distinct genotypes.
The main group within the phylogenetic tree containing the majority of the woodchester badger isolates (purple on the figure below) also contained 16 cattle isolates, which had genetic signatures consistent with badger to cattle transmission events. In several other cases M. bovis isolates from cattle were above those from badgers in tree, this is consistent with there also being cattle to badger transmission of M. bovis.
The results from the analyses reporting rates of transmission within and between species were also very interesting. The best fitting model (statistically this was the best one at explaining the data) had the following results:
![]()
It is important to emphasise that these are estimates from the best fitting model, several of the other models had slightly different results, although these models did not fit the data quite so well. For example, in the second best fitting model transmission rates between badgers and cattle were estimated at being close to equal.
What can we conclude from this study?
- This study provides some of the best evidence to date that badgers can act as a source of M. bovis infection in cattle, but also that cattle can act as a source of infection for badgers.
- Although badgers are more likely to infect cattle this does not mean that badgers are the main source of infection for cattle, or more important than other sources. The majority of disease transmission in this study was within species, both cattle to cattle and badger to badger. This confirms that transmission within the cattle population is also important for spreading bTB.
- Given the high levels of transmission within the badger population and the genetic patterns observed, this study also provides evidence that M. bovis can persist within badger populations for long periods of time without the need for reinfection from cattle. This suggests that without some form of management infected badgers could act as a source of infection for long periods of time.
BUT as with all studies there are caveats and limitations. One obvious limitation of this study is that the data comes from a single study site in Gloucestershire. This is an area with a relatively high density of badgers, and a long history of TB infection in both badgers and cattle. In other areas with different badger populations and cattle populations, the rates of transmission could be different to those estimated here. For more information on the implications of this study read expert opinion on the study at the science media centre.
What does this tell us about the current strategy for controlling TB in the UK? The authors state the following in the final section of the paper….. “In line with a recent evidence review (Godfray et al., 2018), our research also suggests that coordinated bTB control in both cattle and badgers may be necessary to control infection in cattle.”
But this study does not address the type of control strategy used, to quote one of the authors Prof Richard Delahay…..“What the study shows is that in this area both species are involved and we’ve got transmission going from badgers to cattle and cattle to badgers and circulating within both of these populations. Under that scenario, you would imagine you would have to control the disease in both species but how you do that is a completely different question.”
Impacts of badger culling in England: New paper published
October 11th 2019
Industry-led badger culling began in England in 2013 initially in two pilot areas in Gloucestershire and Somerset. A third cull area was licensed in Dorset in 2015, and then since then the number of cull areas has gradually increased.As of the end of 2018 there were 32 cull areas active in England, and this has now increased to a total of 43 (for a list of cull areas see here). Badger culling is hugely divisive and there is a lot of interest in what effect the culls are having on TB in cattle. Previous APHA reports have described the TB statistics for the cull areas (these are interesting but cannot prove if culling is having an impact – see here for the latest published data), and one previous paper has been published investigating the effects of the first two years of culling in the Gloucester and Somerset cull area (Brunton et al. 2017, summarised here).
A new study has just been published in the Journal Scientific Reports by Downs et al. which builds on this earlier work and gives us out best estimate yet of the impacts of the current badger culls. The study uses four years’ worth of data (2013 -2017) for the Gloucester and Somerset cull areas and two years’ worth of data for the Dorset cull area.
Assessing effects from four years of industry-led badger culling in England on the incidence of bovine tuberculosis in cattle, 2013–2017
I am one of the co-authors of this latest study, and together with the other authors I have created a two page summary of the paper which can be downloaded below and on the Tbhub.


It is always a challenge to summarise complex studies in just a few words, and much more detail can be found in the full paper, which I would recommend reading. I have also outlined some additional points relating to different aspects of the study below:
Why use complex multivariable analyses?
You may be thinking…why do the analyses need to be so complicated? Surely you can just look at the TB stats for the cull areas and show if TB is declining or not? Firstly, TB statistics go up and down all of the time (particularly at the scale of a cull area) so to understand effects of culling or any intervention you need to compare trends in the cull areas to comparison areas without culling. The comparison areas used in the current study are selected to be similar to the cull areas, but these areas will never be identical. This is potentially problematic, as TB in cattle is associated with a whole range of risk factors, many of which relate to cattle husbandry and have nothing to do with wildlife or culling (Skuce, Allen & McDowell 2012). This means that there could be differences between cull areas and comparison areas that are unrelated to culling, this could lead to differences in the level of TB in cattle. The multivariable analyses conducted aim test for an effect of culling, while controlling for these other differences. This means that when we describe the results of these analyses we do not simply say “TB declined by X amount” instead we talk about the effect of culling relative to the comparison areas (see below).
Incidence rate ratios (IRR)
The effect of culling and other factors on TB risk is described in the study using incidence rate ratios (IRR). An incidence rate is the rate that a given event (in this case TB breakdowns) happens over time. The statistics in the paper report the incidence rate RATIO (IRR) as this shows the rate of TB breakdowns in the cull areas RELATIVE to the comparison areas where no culling has taken place. For example an IRR of 0.3 would mean that the rate of breakdowns was 30% of that in comparison areas (ie 70% lower), 0.8 would mean it was 80% (or 20% lower) and so on. An IRR of more than one means an increase…..so 1.50 would mean a 50% increase (ie the rate was 150% of that the comparison areas) and 1.20 a 20% increase.
In the tables in the paper the IRR is reported for the intervention effect (culling) and also for several other variables (Table 4). For variables with a continuous scale (eg 1-100 rather than distinct categories) the IRR is the change in incidence rate associated with a 1 unit increase in that variable. For example, the IRR for the variable ‘percentage of herds that were dairy’ was 1.01. This means for every unit increase in that variable there was a 1% increase in the rate of TB breakdowns.
OTF-W, OTF-S or all TB incidents?
Bovine TB is reported in a number of different ways and this means that there are a number of possible statistics that can be analysed:
- OTF-W (Official TB Free Withdrawn): these are TB incidents where there was at least one test reactor or inconclusive reactor with post-mortem evidence of M. bovis infection (judged by the presence of visible lesions typical of TB and/or identification of M. bovis in culture), or at least one slaughterhouse case that yielded M. bovis on culture. In some studies these are referred to as ‘confirmed’ breakdowns.
- OTF-S (Official TB Free Suspended): these are TB incidents where at least one test reactor or two IRs have been identified but evidence of infection could not be confirmed through post-mortem examination or laboratory culture of tissue samples. In some studies these are referred to as ‘unconfirmed’ breakdowns.
- All TB incidents: – This includes both OTF-W and OTF-S incidents (ie all breakdowns regardless of if they were confirmed or not).
The paper largely focuses on changes in OTF-W incidence rates. This is partially because these breakdowns are confirmed as being caused by TB, while it is possible that OTF-S incidents may have been caused by something else. The analyses for the RBCT also focused on changes in confirmed (OTF-W) TB incidents, largely because no significant changes were observed when for all TB incidents or unconfirmed incidents (OTF-S) were analysed.
The paper and the supplementary materials of the paper (a range of extra details and tables published alongside the study) report the results of the analyses using OTF-W and all TB incidents. Analyses of changes in all TB incidents found a decline in the Gloucester and Somerset cull areas (although less than when focusing on OFT-W), but also a significant increase in the Dorset cull area.
Why is the data only up to 2017?
This paper summarises the data up to the end of 2017. This is now nearly two years ago, so why is there such a delay? This is partly because it takes a while to collate the enormous amount of TB data and statistics collected each year. For example the TB statistics covering the period up to the end of 2018 were only published (here) in March of 2019, which is after this paper was submitted for publication. Complex analyses like those reported in this paper also take time to complete, so it is not a simple task of updating the figures (particularly as the licensing of new cull areas may overlap with comparison areas used in the analysis). Finally, the paper also has to go through a process of peer review where it is assessed by anonymous reviewers (typically scientist with expert knowledge of the field). This peer review process is crucially important for ensuring that the science is robust, but it can take many months to complete (anywhere from 3/4 months up to a year or more in some cases).
A few final thoughts on the implications of this study
The key conclusions from the study are outlined at the end of the summary document. However, given the diverse views on badger culling it is inevitable that people will look at this study and come to very different conclusions. In my view it is important that any scientific studies such as these are looked at properly and the limitations and results are fully understood. This study does demonstrate that industry lead culling can result in benefits, measured as a drop in the rate of new breakdowns (relative to other areas without culling). This change in TB incidence is a standard way of evaluating disease management, partly because a fall in the rate of new disease incidents is likely to be the first change that can be detected. Whether culling leads to longer term reductions in disease in these areas, such as a reduction in prevalence (the % of herds under restrictions) we cannot definitively say from these data.
One important limitation of this study relates to the scale of the work. In an ideal world if you wanted to look at the effect of culling (or any disease intervention) you would carry out a randomised, replicated trial. This is what was conducted during the RBCT (for a summary of the RBCT see here) as there were 10 randomly selected areas for each culling treatment. The results from the RBCT analyses then give you an estimate of the average effect of culling (along with a range of uncertainty around this) if it were applied to a given random area. This essentially gives you the power to predict future impacts of culling, assuming it is done in a similar way, place and time (the RBCT was government cage trapping, in areas with high levels of TB in cattle, from 1998-2005).
The current badger culls in England are a programme of wildlife management with the aim of disease control, but they are not a scientific trial aimed specifically at investigating the effects of culling (like the RBCT). So while there may be opportunities to evaluate culling outcomes (like this study), it may be that we are limited in what we can conclude from the results. This latest study provides a good estimate of the effect of industry lead badger culling in the three specific areas studied. As mentioned in the summary document, these areas were not randomly selected and they could be very different from the other licensed cull areas in England. For example, the role that badgers play in cattle TB could be much smaller or larger. The effectiveness of the culling could also be very different due to differences in habitat, badger density, farmer behaviour, protestor activity or government support. This does not mean the results of this study are not valid, but it makes it difficult to predict what effects the culls will have in the other areas. For example, culling in other areas could have a large impact (like a Gloucester), a smaller impact (like Somerset), no impact (yet – as in Dorset) or a totally different impact we haven’t seen yet. It also means that these data cannot be used to confidently evaluate the whole culling policy, just those specific areas studied. Hopefully future analyses will help to shed light on the effect of culling in other areas, as well as the longer term impacts in Gloucester, Somerset and Dorset.
Latest TB trends in badger cull areas published
October 4th 2019
In September APHA published a report with the latest TB figures for the badger cull (control) areas.
Bovine TB in cattle: badger control areas monitoring report For the period 2013 – 2018
The report shows the Officially Tuberculosis Free – withdrawn (OTF-W) incidence and OTF-W prevalence inside badger control areas and in the 2km buffer strip surrounding each area.
OTF-W (Official TB Free Withdrawn): these are TB incidents where there was at least one test reactor or inconclusive reactor with post-mortem evidence of M. bovis infection (judged by the presence of visible lesions typical of TB and/or identification of M. bovis in culture), or at least one slaughterhouse case that yielded M. bovis on culture. In some studies these are referred to as ‘confirmed’ breakdowns.
This data covers up to the end of 2018, which includes the first 21 badger control areas (ie those where culling started between 2013 and 2017). This means that 5 years’ worth of data is available for the first two licensed areas (Gloucestershire and Somerset) and one to three years of data for the other areas. New badger control areas will be included in subsequent reports once they have at least one year of follow-up data available.
The data in the report give raw trends in TB in cattle, but these data alone cannot demonstrate whether the badger control policy is effective in reducing bovine TB in cattle. All these data can provide is a description of the general patterns and trends. In a previous post (when last years numbers were published) I discussed this in more detail and also listed the published details of the current cull areas in England (see here).
The data from the latest report are displayed in the graphs below.
Tip: the below graphs are fully interactive. Pan your mouse curser over the graph to display the values for each point. You can zoom in/out, or export the graphs as images using the tools visible above the graphs (which are visible if you move your mouse curser over the graph).
These graphs are also viewable alongside other TB data as a page in the Bovine TB dashboard I have been developing.
Does badger vaccination reduce TB in cattle?
July 8th 2019
 The injectable badger BCG vaccine (delivered to badgers caught in cage traps) has been licensed for use in badgers since 2010, based on evidence that the vaccine is safe and has a protective effect in badgers (Brown et al. 2013). Captive trials have shown that vaccination reduces the development and progression of disease (Chambers et al. 2011). Results from field trials also demonstrate that vaccination reduces the spread of disease within badger populations, as vaccinated badgers are much less likely to become infected with TB (Carter et al. 2012). Crucially, vaccination is also safe, the BCG bacteria is not excreted by badgers and the vaccination process does not cause perturbation (Lesellier et al. 2006; Woodroffe et al. 2017).
For a summary see the badger vaccination fact sheet, and for more information on perturbation read the fact sheet on the RBCT. The reviews by Chambers et al. (2014) and Godfray et al. (2013) also provide a good summary of the science on the subject.
Logically reducing disease spread in badger populations can only be a good thing for cattle, but are there any studies which prove one way or the other that vaccination does or doesn’t ‘work’?
The short answer is no, there are no specific scientific trials or experiments that have been conducted with the explicit aim of investigating the effect of badger vaccination on TB in cattle. Such a trial would ideally need to be randomised (areas randomly selected to avoid potential bias), replicated (carried out in several locations to demonstrate how effects might vary) and with controls (matched comparison areas without vaccination), which was the case in the RBCT.
However, there are two areas in the UK where large scale badger vaccination has been conducted, these are the BVDP and IAA, which are often mentioned in discussions about badger vaccination.
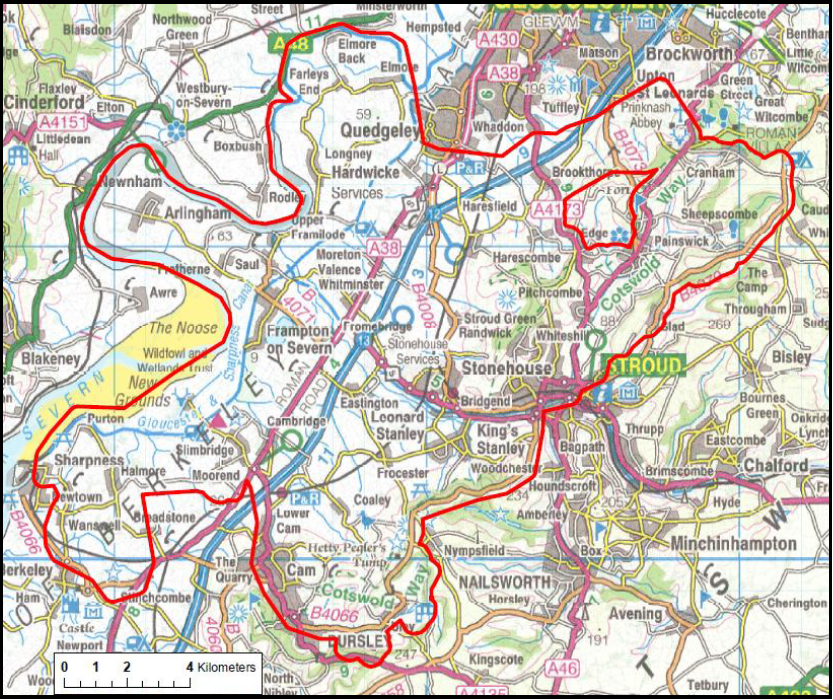
 Map of the BVDP and IAA. Click to enlarge.
The Badger Vaccine Deployment Project (BVDP) – England
This was a 100 km2 (approx.) area in Gloucestershire. Badgers vaccination was conducted from 2010 – 2015 by APHA staff, with an average of 7.6 badgers per km2 vaccinated each year (range = 5.4 to 10.0). The aims of the BVDP are outlined in the BVDP lessons learned report (APHA 2015):
“The BVDP was not set up as a scientific trial to investigate the effect of BadgerBCG deployment on TB in badgers or cattle. Rather, it aimed to provide the first use of a vaccine for bovine tuberculosis in badgers outside of research trials, to develop practical knowledge on the processes involved in vaccinating badgers and to facilitate training of lay vaccinators” – page 3.
The Intensive Action Area (IAA) – Wales
The IAA was a 288 km2 area primarily in Pembrokeshire, but with land also in Ceredigion and Carmarthenshire. The area was selected for a range of extra disease control measures due to having one of the highest rates of TB in Wales, as well as evidence of TB in the local badger population. The IAA was not a vaccination trial, a whole range of measures aimed at cattle and wildlife were applied to the IAA starting in 2010:
- stricter cattle controls and testing
- improved biosecurity measures
- testing all goats and camelids
- badger vaccination (2012 – 2015, delivered by government)
For more information see https://gov.wales/intensive-action-area-iaa
Approximately 3.9 – 4.9 badgers per km2 were vaccinated in the IAA each year. A road kill survey of badgers also recorded low levels of TB in the badger population, with the number of positive badgers declining during the project, but the sample size was too low to show a significant difference (APHA 2016).
Although neither of these areas were established as scientific studies to investigate the effects of badger vaccination, APHA has produced reports looking at changes in TB in cattle in both areas.
What do these reports tell us about the effectiveness of badger vaccination?
The BVPD report
Click here to download and read the full BVDP report
The BVDP report investigated changes in cattle TB incidence rate (the rate of new breakdowns) in the BVDP and four comparison areas. These four comparison areas were selected using a process to identify areas similar to the BVDP in their TB history and cattle herd demographics.
The analyses conducted to investigate changes in TB in the BVDP and comparison areas was descriptive and relatively simple, in that the areas were not directly compared in a single analysis (ie vaccinated vs non-vaccinated, as was used during the RBCT). Rather separate individual analyses were conducted for each area and the trends (increasing or decreasing) were then described. The severe limitations of the analyses meant that it was unlikely any effects of badger vaccination would be detected, as clearly stated in the report:
“It is important to remember that this is a descriptive analysis, and that it is unlikely that any significant changes will be observed. Any analysis of the effect of vaccination is limited by the retrospective and non-randomised selection of comparison areas. In addition, the BVDP was only conducted in one intervention area so it is anticipated that there is the potential for selection bias and that there will be insufficient power to detect the effects of vaccination on cattle incidence in the area.” (page 5)
Did TB change in the BVDP area?
The TB incidence rate in cattle significantly declined throughout the course of the BVDP, with a reduction in OTF-W (official TB free withdrawn) breakdowns of more than 50% by the end of the five year project. However, there were also significant declines in three of the four comparison areas (see figure). This could suggest that the decline in the BVDP would have happened without vaccination, but it is difficult to be sure using the analyses used.

Trends in OTF-W incidence per 100 herd years at risk over time in the central areas of the BVDP area and the comparison areas (dashed lines indicate the start of vaccination).
For example, when analyses similar to those in the BVDP report were applied to the Gloucestershire and Somerset cull areas (which are both 2-3 times larger) they found no effect of culling. Effects of culling were ONLY detected using much more sophisticated multivariable analyses (controlling for other non-cull effects) directly comparing the cull areas to TEN comparison areas (Brunton et al. 2017, read the fact sheet here). This highlights the importance of robust analyses, and the risks of coming to false conclusions if they are not conducted properly.
One other major problem is that the BVDP is a single area, and it is unclear whether this is representative of the wider landscape in relation to the role of badgers, or other factors relevant to TB (as many other factors influence TB risk ). TB was declining prior to vaccination in the BVDP and the similar matched areas experienced a drop in TB without any specific intervention. This could suggest that other non-wildlife factors were important in these areas, or changed during the trial.
The limitations of the analyses are described in detail in the report. The authors also make it clear that it would be wrong to come to firm conclusions about the general impacts of vaccination:
“The factors discussed here make assessing the impact of badger vaccination on cattle bTB incidence difficult and drawing firm conclusions from the data analysed here on the impacts of badger vaccination inappropriate.” – page 15
The IAA report
Click here to download the full IAA report
As with the BVDP report, the analyses conducted on the IAA were quite simple and descriptive in scope (ie they describe trends but make no attempt to identify the factors causing them). Trends in TB incidence (breakdown rate), prevalence (% of herds restricted) and a wide range of other TB metrics were compared for the IAA and a comparison area in west Wales.
Did TB change in the IAA?
Because of the range of different statistics calculated it is difficult to give a simple answer to this. Some metrics showed an improvement, for example the proportion of herds under restrictions in the IAA (prevalence) fell from 22-30% in the early part of the study to 14% by 2016. There was also a 35% reduction the TB incidence in the IAA, relative to a 22% reduction in the comparison area (these differences were reported by farminguk and the BVA). However the authors of the report do state that “Notable differences in indicators of TB incidence have not yet been seen” (as of 2016).

Herds under restriction because of loss of OTF status in the IAA and comparison area. Taken from report.
The IAA report makes no statement on the effects of badger vaccination, partly because vaccination was used alongside a wide range of other measures, which makes it impossible to determine which specific measures did or did not work.
Another reason it is difficult to draw conclusions is because the IAA is a quite different to the comparison area used in the analysis. This can be seen in the figure above, as the prevalence in the comparison area is much lower than the IAA. This issue is also further outlined by the authors:
“Selection of the IAA and the CA (comparison area) was not performed randomly, nor were either area replicated. There are known demographic differences between the IAA, the CA and the other areas which might influence TB trends in those regions independently of policy interventions. For example, there are a higher proportion of large dairy herds in the IAA than in other areas, and such herds are considered more likely than beef herds to see TB incidents, regardless of location. Consequently, it is not appropriate to use conventional statistical tests when making comparisons because the areas are not directly comparable.” – page 8
This is not surprising, as the IAA was not chosen to be representative of the wider welsh countryside. It was chosen due to the high levels of TB and for other differences which make controlling TB challenging, hence the ‘intensive’ approach taken. By definition the outcome of any intervention in the IAA is likely to be quite different to other areas, with different levels of TB in badgers and cattle.
Conclusions

Predicted distribution of infectious environmental reservoirs (including wildlife), as estimated by modelling. Figure taken from Birch et al. 2018. Click image to enlarge.
So what can the IAA and BVDP tell us about the effect of badger vaccination on TB in cattle? Unfortunately very little. In both areas there was evidence of TB declining in the cattle population, but it is not possible to say whether vaccination contributed to this or not.
The authors of both the IAA and BVDP reports make it very clear that neither of these projects were intended as a scientific studies to prove or disprove the effects of badger vaccination. The authors also clearly outline several reasons why it would be wrong to use the descriptive analyses conducted to come to firm conclusions about vaccine effectiveness. Proving the effect of any intervention, whether its culling, vaccination, biosecurity or other cattle measures is extremely difficult, either requiring large replicated controlled trials (like the RBCT), or robust sophisticated statistical analyses. The contribution of badgers to TB in cattle likely varies hugely across the UK (Birch et al. 2018). This also means that impacts of vaccination (or any intervention) will also likely vary, and that the results from one area may not apply to other areas where the situation is very different.
Until further trials or analyses are conducted it is not possible the say definitively what effect badger vaccination will have on TB in cattle. There is however, good scientific evidence that vaccination is an effective means to reduce transmission and disease spread in badgers (as summarised here). If the aim is to have fewer infected badgers in the landscape, then vaccination is a potential tool to achieve this. Vaccination is also a viable option in parts of the country where the badger population is currently free of TB, as a way of reducing disease spread and future risk to cattle.
Badger visits to farm yards – new paper published
June 12th 2019
Several research studies have shown that badgers will enter farm yards where they may contaminate the farm environment (feed, water troughs etc) or come into close contact with cattle (Garnett, Delahay & Roper 2002; Tolhurst et al. 2009; Judge et al. 2011; O’Mahony 2015). Feeding opportunities seem to be a key driving factor behind this behaviour, as yards and buildings may contain high energy animal feeds which are attractive to badgers (click here to see a list of feed sources attractive to badgers).
Work by APHA has shown that practical measures such as sheet gates or electric fences can be used to keep badgers out of farm yards (Judge et al. 2011), and it is recommended that farmers use such measures where practical in their farms to reduce the risk of disease spread (see the TBhub). However, previous studies on badger activity in farm yards have shown that levels of activity can vary hugely (Mullen et al. 2015; Woodroffe et al. 2017). This raises the question as to how widespread this behaviour is and whether particularly farms are more likely to experience badger visits than others.
Recently we published a paper in the Journal PLOS One on the subject of badgers in farm buildings…
This study aimed to answer several questions:
- How widespread are badgers visits to farm yards?
- Which farm characteristics are associated with visits by badgers?
- Can we predict this behaviour and identify farms where visits occur?
The paper is open access (free to view), but I thought it would be useful to produce a short summary for those who want the key information.
What did the study involve?
The study involved monitoring badger activity at 155 farms across south-west England and Wales. Each farm was monitored for one month using trail cameras (click here for advice on using cameras to monitor badger activity).
Each farm was also surveyed for badger field signs (setts, latrines etc) and a range of other farm characteristics were recorded (farm type, number of cattle, numbers of different buildings etc).
A range of statistical analyses were then conducted to look at how common badgers visits were, and also determine which farm characteristics were associated with badger visits.
How widespread were badger visits to farm yards?
Overall 41% of farms had evidence of farm visits (badgers recorded on camera), although the level of activity (number of nights badgers were seen) was quite variable.

Examples of badgers in farm yards recorded during the study
Which farm characteristics were associated with badger visits?
The presence/absence of badger visits was significantly related to several farm characteristics……
- Badger visits were more likely at farms with higher numbers of feed stores and cattle sheds (suggesting more feeding opportunities?)
- Badger visits were more likely at farms with higher numbers of badger setts (within 500m), and where the nearest active sett was located closer to the farm.
- Badger visits were less likely at farms which housed large numbers of cattle and where there was a farm house on dwelling on site. This could indicate that the farm was larger or had higher levels of human disturbance that may deter badgers?
The frequency of visits (ie the number of nights badgers were recorded) was related to only two factors:
- Number of cattle housed (higher number = fewer visits)
- Distance to the nearest active badger sett (closer sett = more visits

Can we predict this behaviour and identify farms where visits occur?
Statistical models (which identified the different relationships above) were used to predict badger visits at 40 farms with known levels of badger visitation which were intensively monitored as part of an earlier study (Judge et al. 2011). Much like when developing a new diagnostic test, different cut off values can be chosen (ie above this cut off farms are classed as being likely to experience badger visits) which affect the accuracy of the models predictions, along with the sensitivity and specificity.
- Sensitivity – the % of farms with badger visits that were correctly classified
- Specificity – the % of farms without badger visits that were correctly classified
Overall the models could predict the presence /absence of badger visits with a 72% accuracy (sensitivity = 62%, specificity= 81%). However these number could potentially be changed by using a different cut off value.
The models were less accurate at predicting the frequency of badger visits (ie not only identifying farms where badgers were present, but those which had lots of visits rather than just one or two). Although, farms predicted as having badgers present tended to be those with higher overall levels of activity.
We also created an interactive tool where users can enter the characteristics of a given farm and generate predictions.
Click here to try the interactive Badger Farm Assessment Tool
What can we conclude from this study?
This study further confirms that badger visits to farm yards may be widespread, affecting a significant proportion of farms within the area studied (south west England and wales). Although it should be noted that the farms were not randomly selected, so the sample of farms could be slightly biased. The study also highlights that certain farms are more likely to be of visited than others, which could help to focus biosecurity measures in a more targeted way.
The results from the study differ from several recent studies, which suggest that badger visits to farm yards are uncommon or that badgers avoid farm yards. It is important to stress there are some important differences with this study and these earlier studies, both in their scale and in the way that badger activity was recorded. This study also demonstrates that certain types of farms are more/less likely to be visited, so it is possible that farms monitored in these earlier studies fall into a low risk/less likely to be visited category.
For further details on what this study involved and for a more thorough discussion of the results – read the full paper here.

It isnt just badgers we recorded in farm yards!
TB in other livestock and domestic animals
March 1st 2019
Mycobacterium bovis (M. bovis) causes bovine TB in cattle and it can also infect badgers and a range of other wildlife (addressed in another fact sheet). But what about other livestock like sheep or pigs? Or domestic animals like dogs and cats? Can they also be infected? And if they can, is there a risk to cattle or wildlife?
To address these questions I have produced a fact sheet with input from veterinary experts from APHA. This can be downloaded by clicking the image below, or by going to the TB fact sheet page of this website.

In addition to this factsheet there are a number of other great information sources if you are interested in TB in other livestock or domestic animals.
Firstly the non-bovines section of the TBhub has really useful information and links to government advice.
The role of non-bovines is also discussed in length in the recent Godfray report (2018). See chapter 7 on page 80. Within this section there are also figures quoted of the numbers of other livestock found infected with M. bovis each year. As you can see below, the numbers are generally very low. To download spreadsheets containing these data go to the gov website here.

For a more in depth review of the subject there is a two part review by (Broughan et al. 2013). Part one reviews evidence/epidemiology of TB in other species. Part two then covers the different tests for TB available for non-bovines.
If you are interested, but cannot access these papers then feel free to contact me and I will be happy to send them to you.
Can M. bovis survive in silage?
February 11th 2019
TB transmission via contaminated feed
 Bovine TB is caused by Mycobacterium bovis (M. bovis), but it is unclear how the bacteria spreads between hosts, whether that’s between cattle, or between cattle and wildlife. One potential route is by ‘indirect’ transmission, where an infected animal contaminates grass, stored feed, water or other parts of the farm environment, and then another animal interacts with this contamined material and becomes infected.
Studying these indirect transmission routes is very difficult, but research has shown that M. bovis can survive in different environments such as water, soil, and faeces and a range of stored feed types (Fine et al. 2011). Research from the United states has also shown that M. bovis can spread from infected deer to cattle via contaminated troughs and housing (Palmer, Waters & Whipple 2004). This is why current guidance in the UK is to keep badgers out of stored feed and housing to reduce opportunities for disease spread.
But what about silage?
 Badgers may be attracted to open silage clamps, particularly those containing whole crop wheat or maize silage (click here for a list fo feed attractive to badgers), so it is advisable to reduce badger access if possible. BUT – silage could also potentially become contaminated in the field, either from infected badgers, or if contaminated slurry is spread on the field (click here for a factsheet about TB in slurry and faeces). Silage goes through an ensiling, or fermentation process, where oxygen levels are low and the pH becomes acidic. Previous reviews of the subject have highlighted that M. bovis could potentially survive in these conditions, but these reviews have also highlighted the lack of science in this area.
Recently a study was published in the United states by (Grooms et al. 2019), which directy addresses the question of M. bovis survival in silage:
Grooms et al. (2019) Survival of Mycobacterium bovis during forage ensiling. American Journal of Veterinary Research, 80, 87-94.
Given the interest in this subject, and the fact that this paper is a difficult to access journal, I have produced a summary of the paper below.
What did the study invovle?
The study involved experimentally adding M. bovis to samples of cut forage which was then ensiled in the lab.
Three different feed types were tested:
- Alfalfa – dry matter content at ensiling 36%
- ‘Mixed mostly grass’ – mainly orchard grass (not specified, but I believe this is cocks foot), with some alfalfa and clover. – 65% dry matter content at ensiling (this was higher than intended, the target was 40%)
- Maize (‘chopped corn’) – 32% dry matter content at ensiling Samples were spiked with M. bovis prior to ensiling, with samples arranged in replicate groups of six; four samples containing M. bovis and two with no M. bovis ( to act as controls).After each period of time the samples were then tested for M. bovis using two methods
Each group of six samples were then ensiled for one of ten different periods spanning 0 – 112 days (meaning 60 samples of each forage type). Samples (250g of each) were placed in thick vaccuum packed polythene bags, wrapped in black liners and and stored at room temperature (18-22°C) to simulate the ensiling process.
After each period of time the samples were then tested for M. bovis using two methods:
- Culture – M. bovis is grown in the lab
- PCR – tests for the presence of M. bovis DNA (click herefor a factsheet on PCR testing)
What did the study find?
This study had three key results:
- The study found that M. bovis could be cultured from Maize and Alfalfa silage up to two days into the ensiling process, and up to 28 days in grass silage. All samples tested after this period tested negative. The authors suggest that the longer survival in grass could be due to the higher (less acidic) pH recorded in these samples (pH was around 5 while maize and alfalfa was closer to 4). This could also be due to the higher dry matter content in the grass samples in the study.
- M. bovis DNA could be found in some samples of all three silage types up to the end of the study (day 112).
- None of the control samples tested positive on either culture or PCR
What do these results mean?
To quote the authors “these results suggest that properly ensiled forages would be an unlikely source for M bovis transmission to cattle”, as M. bovis could not be cultured after 28 days in any of the samples. M. bovis DNA was detected beyond this date, right up to the end of the study. However, it is not clear whether the bacteria are viable (ie if they could grow or infect an animal). One possibility is that the bacteria are ‘dormant’ and that changes in conditions in the future could make them infectious, but it is unclear if this is possible (and what condictions could causes this).
Although this study has some very interesting results, it is important to acknowledge that this is an experimental study, and no experiment is perfect. M. bovis was added at very high concentrations to the forage samples (tens of millions of backeria in each 250g sample), which is likely much higher than contamination would occur naturally. The primary method of testing for M. bovis (culture) is also not 100% perfect, so could potentially fail to detect the bacteria, even though it was present. It is therefore possible that M. bovis survival in natural conditions is longer or shorter than stated here. Nevertheless, this study provides the best information to date on the likely survival of M. bovis in silage.
Overall conclusion : The study suggests that properly ensiled forage is unlikely to be a source of infection in cattle, although the detection of M. bovis DNA up to the end of the experiment means that the risk cannot be totally ruled out.
The factsheet on TB survival in feed, water and soil has now been updated to reflect these new results.


